Abstract
Agriculture remains dependent on climate and climatic resources, uneven distribution of monsoonal rainfall, due to climate change, around the country may result in some parts getting flooded while others facing drought, leading to mass migration of people and insecurity of availability of food to all. Timely assessment of climate change effects on agriculture might help to adapt suitable farming techniques to maximize agricultural production. The response of C 3 and C 4 crops to elevated CO 2 levels when exposed frequently to water stress or changes in climatic factors such as temperature or rainfall may provide variable results. Current crop growth models, simulate not only the effect of increased temperature but, also consider the effect of increased CO 2 on morphology and phenology of crop. Simulated yield of wheat (HUW 468) decreases from the baseline in 2050 and 2080 while, a meager increase of 3% may o ccur in 2020 at Pusa. At Madhepura, a decline of 21% in simulated yield of wheat (HD 2733) from the baseline may be observed for 2080. Patna and Sabour may show a decrease in simulated yield of almost 40 % upto 2080s. Simulated yield of rabi maize may increase to 11 %, 25% and 77 % upto 2020, 2050 and 2080 respectively for the stations under study. Reduction in simulated yield of wheat without CO 2 increase is higher than simulation with CO 2 increase for all stations and scenarios. For 2020s difference in reduction percentage between simulated yield with and without CO 2 increment is less as compared to 2050s and 2080s. While, in case of maize an increase in yield is observed with or without CO 2 increase but the increase is more at enhanced CO 2 . Introduction Climate change refers to th e variation in earth’s global climate or in regional climates over timescales ranging from decades to millions of years. Greenhouse gases (GHG’s), are effective in tr apping heat at the earth’s surface, without GHG’s, most of the currently cultivated regions of the earth would be too cold for agricultural production. However, human activity is contributing to increases in GHG concentrations in the atmosphere and the increases are causing potentially
Material and methods
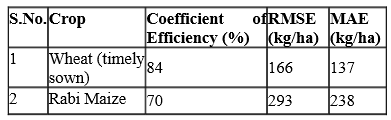
For this study four stations (figure 1) are selected, representing each zone, on the basis of availability of meteorological, soil and crop data. The weather data obtained from different centers was analyzed. The existing data on baseline conditions in the selected locations, crop yields and farm ers’ practices and yields on the basis of recommended practices are collected. The crop, meteorological and soil data for selected centers are collected from BA C, Sabour (Bhagalpur), IARI, Pusa, TDC, Dholi (Muzaffarpur), IRS, Madhepura, RAU, and Pusa. INFOCROP as a dynamic process growth model is validated and calibrated as per the availability of data for Pusa, Sabour and Patna for wheat, rice, maize and chickp ea crop. Info crop model is used to simulate impact of different scenarios of climate change on the basis of available climatic data and crop data. For calibration purpose the input data for model simulation is fixed and consecutively parameterized to the model required form. The model simulates the grain yield and simulated yields are compared with observed yields thus validating the model outputs (table2). Sabour: 25.33 0 N, 87.17 0 E, 11m Pusa: 25.85 0 N, 85.78 0 E, 38m Patna: 25.58 0 N, 85.25 0 E, 41m Madhepura: 26.11 0 N, 86.23 0 E, 53.95m Sabour: 25.33 0 N, 87.17 0 E, 11m Pusa: 25.85 0 N, 85.78 0 E, 38m Patna: 25.58 0 N, 85.25 0 E, 41m Madhepura: 26.11 0 N, 86.23 0 E, 53.95m The monthly mean change in maximum and minimum temperature and the monthly percentage change in rainfall given in the HADCM3 GCM projections are incorporated into the baseline (historical weather data) to generate scenarios of 2020, 2050, and 2080
Table2: Validation results for Pusa location
Results and Discussion
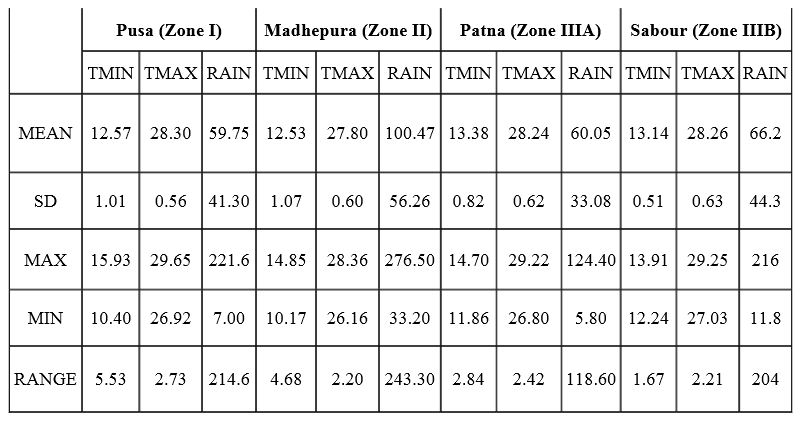
Variability of climatic parameters of selected stations during rabi season (Nov-April) Analysis of weather data during the study period showed (table.3) interannual variation in weather variables. Rainfall ranges from 7 to 221.6 mm, 5.8 to 124.1mm, 33.2 to 276.5 mm and 11.8 to 216 mm for Pusa, Patna, Madhepura and Sabour respectively. Rainfall showed almost no significant trend over 30 year period for any station. Rainfall trend shows a decrease in zone I and zone II by 0.46 and 0.42 mm per year respectively, and for zone III A and IIIB, an increase in rainfall by 0.38 and 0.97 per year respectively.
Rabi Maize
An increase in yield is observed with or without CO 2 increase but it is more if CO 2 enhancement is considered. The difference in yield is meager for 2020 and 2050, while the differe nce between the increase percentage for 2080 with and without CO 2 increase shows a marked difference. Increasing temperature reduces duration of wheat crop (Midmore et al., 1982). Loss of chlorophyll during grain filling has been associated with reduced field performance of wheat in warm environments (Reynolds et.al., 2000). Fischer (1985) calculated a kernel number reduction rate of 4% per 0 C in wheat ranging between 14 0 C-22 0 C. Reduced source on yield is confirmed by reduced kernel weight in response to elevated temperature, with kernel weight affected typically by a 2-5% decrease per 0 C increase (Wardlaw and Wrigly 1994). These are the possible reasons for reduced yield performance of wheat with increased temperature under different climate change scenarios. Cultivation of Maize is limited by cold sensitivity as manifested by retardation of growth at temp. 10-15 0 C (Stamp, 1984; Verheul et al., 1996) as well as by leaf necrosis and plant death at temperatures below 10 °C (Janowiak and Markowski, 1994). Maize is a C4 crop and is remarkably tolerant of high temperatures (Jones and Thornton, 2003). Hardcare and Turnbull (1986) observed that relative growth rate and net assimilation rate of maize increased with temperature in controlled environments from 16 to 28 0 C. Thus maize possibly benefits from increase in minimum temperature and CO 2 under future scenarios. Elevated CO 2 alone tends to increase growth and yield of most agricultural plants by regulating the opening and closing of stomata, reducing transpiration per un it leaf area thus enhancing photosynthesis as well as water use efficiency (Parry et al., 2004). From this study it can be concluded that increasing temperature may prove ha rmful for the wheat crop while it is proving beneficial for the maize crop grown during rabi season. Increasing the levels of CO 2 is affecting the wheat and maize crop beneficially, by bringing an increase in yield. Decrease in yield of wheat in different scenarios, may be attributed to the increase in maximum temperat ure while the increase in maize yield may be because of the higher night temperatures. Maize crop being sensitive to cold temperature stress and also being more tolerant to higher temperatures is able to thrive well in warmer temperatures that might develop in future. The study is based on present varieties and management practices and does not include the possible effect of pest and diseases and changes in soil parameters with increased temperature.
Acknowledgement
Authors wish to acknowledge the support received 14 Manthan , International e - Journal, Vol. 11, June, 2010, ISSN No. 0974 - 6331 Evaluating physiological traits to compliments. Euphytica 100: 85-94 Stamp P. 1984; chilling tolerance of young plants demonstrated on the example of maize (Zea mays L.) In: Geisler G, ed. Advances in agronomy and crop science 7, Berlin: Paul Parey. Verheul MJ, Picatto C, Stamp P. 1996. Groeth and development of maize(Zea mays L.). seedlings under chilling conditions in the field. European Journal of Agronomy 5, 31-43. Wardlaw, I.F. and C.W. Wrigley. 1994. Heat tolerance in temperature cereals: An overview. Australian Journal of Plant Physiology 21: 695-703 |
|
detrimental changes in temperature and other aspects of climate. The atmospheric concentration of CO 2 in 2005 was 379 ppm compared to the pre-industrial levels of 280 ppm (IPCC 2007). Global annual-mean surface temperature has shown a rapid and widespread increase of 1.4º F (0.7ºC) since the early 20 th century with about 0.9º F of that increase occurring after 1978. It is also estimated that by 2100, av erage temperatures will increase by between 1.4° and 5.8°C (IPCC). Agricultural productivity and production is predicted to decline due to climatic changes. 0.5°C rise in winter temperature would reduce wheat yield by 0.45 tonnes per hectare in India (Lal et al ., 1998; Kalra et al., 2003). 2 to 5% decrease in yield potential of wheat and kharif maize for a temperature rise of 0.5 to 1.5°C in India (Aggarwal, 2003). State of Bihar lies between 24 0 to 27 0 N, 83 0 to 88 0 E with a height of 52.73 m above mean sea level Bihar is having total geographical area of 9.36 million hectares with cultivable land of 0.58 lakh hectares, with normal rainfall of 1176.4 mm (anonymous 2007). The state falls in the middle-Gangetic plains region. It is sub- divided into three agro-eco logical zones. These are, Northwest Alluvial Plains (Zone-I), North-East Alluvial Plains (Zone-II) and South Bihar Alluvial Plains (Zone-III A and III B). Major crops grown in agro-ecological zones of Bihar are depicted in table1. Gross cropped area is maximum (30.07 lakh hectares) for zone I and minimum (6.21 lakh hectares) for zone III B, irrigated area ranges from 3.68 lakh hectares to 18.41 lakh hectares, Zone II receives highest annual rainfall (1387 mm) and is also the coldest among the three zones (average temperature: 21.3 0 C). Zone III receives least rainfall (1104 mm) and is also the warmest of the zones of Bihar (average temperature: 22.45 0 C).
Table1: Major crops grow n in different locations
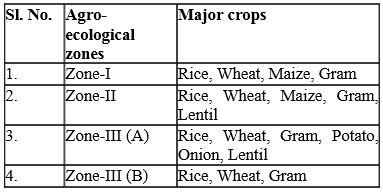
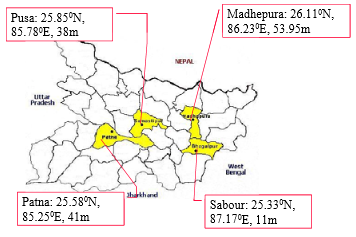
Fig1: selected lo cations for study
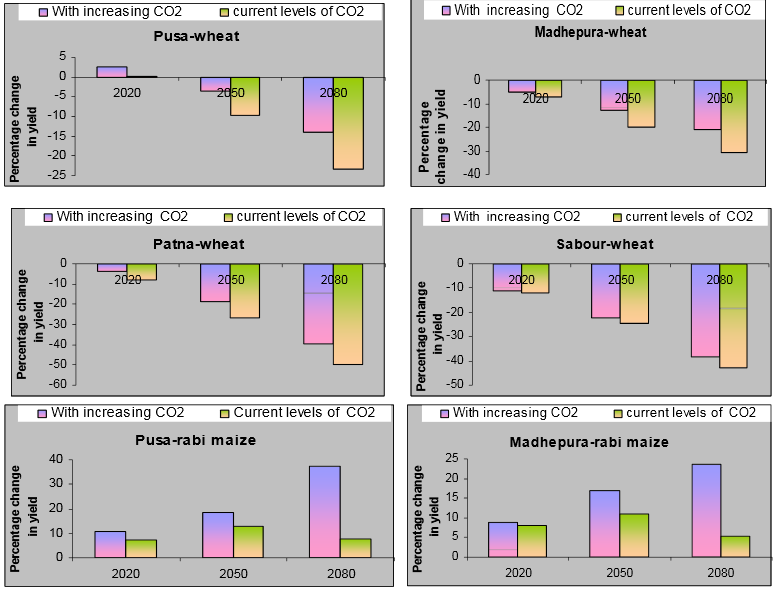
Impacts of climate change on wheat and rabi maize With increased CO 2 levels from 370 (414, 522 and 682ppm) and changing temperature
With the current cultivars, cultivation and management practices, the impacts of climate change on three varieties of wheat namely HD 2733, HUW 468, RW 346 and a variety of maize Ganga-11 under A2 scenario are explored at the selected centers All the results (figure 2) are taken by comparing the yields between A2 climate change scenario time scales, i.e. 2020, 2050 and 2080, and baseline (1961-1990)
Wheat
Simulated yield of wheat (HUW 468) decreases from the baseline in 2050 and 2080 to 4 and 14% respectively while, a meager increase of 3% may happen upto 2020 at Pusa. At Madhepura, a decline of 5, 13 and 21% in simulated yield of wheat (HD 2733) from the baseline may be observed for 2020, 2050 and 2080 respectively. Patna and Sabour may show a decrease in simulated yield of almost 40 % upto 2080s
Rabi Maize Simulated yield of rabi maize may increase from 8 to 11 %, 14 to 25 % and 24to 77 % upto 2020, 2050 and 2080 respectively for the stations under study for all the three scenarios from the baseline yield. Maximum increase is observed in Sabour may be due to low baseline yield
With current level of CO 2 but changing temperature Wheat
Reduction in simulated yield of wheat without CO 2 increase is higher than simulation with CO2 increase for all stations and scenarios. For 2020s difference in reduction percentage between simulated yield with and without CO 2 increase is less as compared to 2050s and 2080s, considering increase in CO 2 while simulating, has a beneficial effect on the yield upto 10% for 2080 scenario. rom ICAR “Netwo rk Project on Climate Change” for conducting the study.
References
Aggarwal, P.K., 2003: Impact of climate change on Indian agriculture. Journal of constitutional factors in rice plants. Proc. Crop Sci. Soc . Jpn, 26: 243–244. Fischer, R.A. 1985. Number of kernels in wheat crops and the influence of solar radiation and temperature. Journal of Agriculture Science 105: 447-461 Hardacre A.W. and Turnbull H.L. 1986. The growth and development of maize (zea mays L.) at five temperatures. Ann of Bot .58, 779-787. IPCC, 2007: Summary for Policymakers. In: Climate Change 2007: The Physical Science Basis. Contribution of Working Group I to the Fourth Assessment Report of the Intergovernmental Panel on Climate Change [Solomon, S., D. Qin, M. Manning, Z. Chen, M. Marquis, K.B. Averyt, M.Tignor and H.L. Miller (eds.)]. Cambridge University Press, Cambridge, United Kingdom and New York, NY, USA. Janowiak F, Markowski A. 1994; changes in leaf water relations and injuries in maize seedlings induced by different chilling conditions. Journal of agronomy and crop science, 172, 19-28. Jones P.G, Thronton P.K. 2003. The potential impacts of climate change on maize production in Africa and Latin America in 2055. Global Environmental Change 13, 51-59. Kalra, N., P.K.Aggarwal, S. Chander, H. Pathak, R. Choudhary,A. Chaudhary, S.Mukesh, H.K. Rai, U.A. Soni, S.Anil,M. Jolly, U.K. Singh,A. Owrs andM.Z.Hussain, 2003: Impacts of climate change on agriculture. Climate Change and India: Vulnerability Assessment and Adaptation , P.R. Shukla, S.K. Sharma, N.H.Ravindranath,A. Garg and S. Bhattacharya, Eds., Orient Longman Private, Hyderbad,193-226. Lal, M, Singh, K.K., Sriniv asan, G., Rathore L.S, and Saseendran A.S. 1998. Vulnerability of rice and wheat yields in NW –India to future change in climate. Agric.For. Meteorol . 89, 101-114. Midmore, D. J., P.M. Cartwright, and R.A. Fischer. 1984. Wheat in tropical environments. II. Crop growth and grain yield. Field Crops Research 5: 397-405. Parry, M.L., Rosenzweig, C., Iglesias, A., Livermore, M., Fischer, G., 2004, eff ects of climate change on global food production under SRES emissions and socio-economic scenarios, Global Environmental Change 14, pp. 53-67. Reynolds M.P., R.P. Singh, A. Ilbrahim, O.A. Ageeb, A. Larque-Saavedra, and J.S. Quick. 1998 |